
Dedicated injection moulding simulation for MIM should not focus solely on general results such as weld lines or pressure loss. A further step is required. Phase separation is a major influence on the quality of the green part, and therefore on the visual and mechanical properties of the sintered product.
Listen to industry; people often talk about “black lines” as an indicator for phase separation. It can be agreed that areas marked by “black lines” typically show an elevated binder concentration and cause real quality issues. During sintering these areas either become visual defects or true mechanical weak points. However “black lines” are not the origin of phase separation. In this area, cause and effect are easily confused. Phase separation can be predicted by adjusting a true 3D simulation for the specific needs and thermo-rheological particularities of MIM.
The main challenge for the production of metal injection moulded parts is to control the long process chain. Issues with the article quality such as visual defects or even cracks often cannot be identified before the end of sintering. Some, probably most, of these defects are already “moulded in” while injecting the MIM feedstock into the cavity. For a part producer this is always the worst scenario: Not detecting scrap before end of the production process chain. Talking to people from the industry makes clear that the challenge preventing companies reducing costs and time to market as well as increasing productivity and competitiveness is that there is no reliable link available between quantifiable properties of the injected moulded part and the final quality defects of the sintered article. Modern 3D injection moulding simulation has the potential to close this gap.
Powder binder separation is considered to be a dominant effect causing quality issues like visual defects, porosity, warpage and cracks. For some feedstocks “black lines” are a strong indicator of powder binder separation. Other feedstocks don't have this integrated visual go-no go signal, but also show separation effects. Even when, for some feedstocks, the green quality can be evaluated from a visual impression, quantifiable criteria are still missing. When are black lines truly critical? Which actions are promising and will reduce separation effectively? At which stage are mould corrections necessary to avoid a black line in a certain cavity area? Those questions cannot be answered by intuition or experience. Simulation is a tool that can give the answers, making decisions safe and based on fact.
For years reliable injection moulding simulation was not available for MIM. Due to a European Research project called “MATLAW” this gap is now bridged [1]. The SIGMASOFT [2] simulation is already validated for MIM to accurately predict filling pattern, pressure loss, weld lines, sinkmarks and other phenomena. This allows optimisation of gate positions or mould tempering [3]. The new milestone is to predict phase separation and to link properties of the green part to quality of the sintered part.
Cause and effect
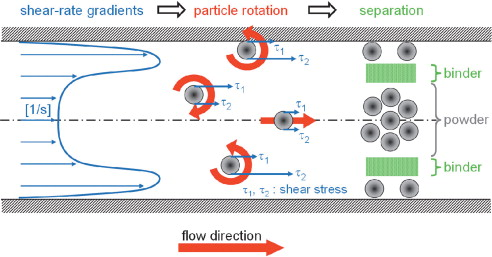
MIM feedstock is always a mixture of metal powder(s) and binder components. The basic requirement for high quality production is a homogenous mixing of powder and binder and thus an even distribution of the powder in the fresh feedstock granules. In addition batch-to-batch variations have to be minimised. Given an initial homogenous powder distribution the question occurs: What are the driving forces behind powder - binder separation? Several hypotheses have been formulated in the past [4]. One approach focuses on local shear rate gradients forcing powder particles to leave areas of high gradients. The physical effect behind this approach is visualised in Figure 1.
Figure 1 shows a typical shear rate pattern across the thickness of a flow channel. The feedstock flow should be imagined from left to right. Due to adhesion of the feedstock at the mould wall, one observes a significant shear rate peak close to the wall and a plateau at a much lower shear rate level in the middle of the flow channel (similar to polymer flow). MATLAW proved the assumption of adhesion at the wall is valid for a wide range of feedstocks. Wall slippage could not be detected for all investigated feedstocks.
It is well known that shear rates are related to shear stresses. Focusing on the powder, the powder particles experience reaction forces depending on their current position in the shear rate (stress) gradient field. The actual particle size/diameter and the particle size distribution are additional important parameters. Particles travelling in the middle of the flow channel within the plateau of the shear field experience uniform reaction forces and continue their way without changing direction. All particles travelling not completely within the shear plateau experience a non-uniform stress field resulting in a rotation of the particles. The rotation becomes bigger the bigger the shear-stress gradients are. The rotation initiates a change in the flow direction of the particles. Those particles try to leave areas of high shear-gradients and powder – binder separation occurs. This approach is applicable for spherical particles and particles with diameter of at least 1 μm which makes it suitable for MIM.
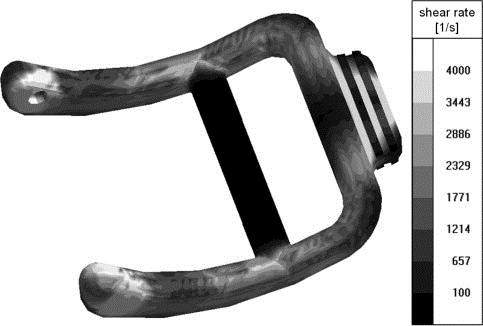
Depending on the actual feedstock flow behaviour and the particle size one would expect a separation pattern as shown on the right side of Figure 1. Particles can be found in the surface contact layer at the mould wall. The subsequent area of the shear-rate peak is characterised by high binder content while in the middle of the flow channel the particle concentration is much elevated. Based on this approach one could conclude intuitively that the shear rate distribution simulated with injection moulding simulation (Figure 2) indirectly visualises the powder – binder separation pattern too. This quick conclusion is, unfortunately, not accurate.
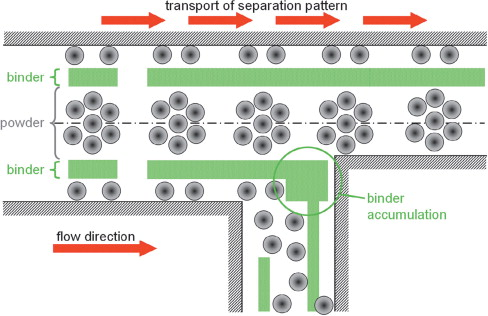
It is important to differentiate precisely between cause and effect. The approach formulated above describes the driving forces of binder and powder separation. Local shear rate gradients are the cause of separation. Unfortunately the locations of maximum shear rates, Figure 2, are not necessarily the locations where the defects are detected on the green part. Location of cause and location of effect are definitely not the same, due to the feedstock flow. Figure 3 shows the phenomenon in a simplified way. The feedstock flow transports the separation pattern and changes the pattern continuously.
Imagine a small feedstock volume unit travelling through the cavity. At the beginning of injection this volume unit travels in the centre of the runner system containing a certain powder and a certain binder concentration. The shear rate gradients in the runner system are quite low and powder and binder concentration remain almost constant until the volume unit arrives at the gate area. Usually in the gate area high shear rate gradients occur. In keeping with the approach formulated above our volume unit, travelling in the centre of the gate, gains additional powder particles. The particle concentration in the volume unit increases while the binder concentration decreases. However our volume unit quickly travels through the gate area and subsequently flows through additional areas of elevated shear and lowered shear until it ends up in its final position somewhere in the cavity. During its whole travel it gains and looses powder particles depending on the travelling history. Different volume units experience different travelling histories.
To understand the separation process of powder and binder the history of the feedstock travelling through injection machine, nozzle, runner system and cavity has to be understood. Simulation has to take this history into account when reliable predictions of powder – binder separation are required.
For analysing and trouble shooting existing moulds the location of defects in the article are already known and a view of the shear rate pattern could give initial hints in which areas elevated shear gradients initiate the separation. In this way optimisation approaches can be found based on interpreting shear rates. This methodology is however not promising for the development of new products. Here simulation has to meet the requirement of predicting the location where defects are probable before the mould is built. The case study at the end of this article describes how this prediction is possible today. In addition further development of the software is already under way to directly model the powder – binder separation.
Feedstock flow is typically modelled as a bulk by the complete set of 3D Navier Stokes equations. Considering feedstock as a bulk means that the model cannot differentiate between powder and binder (one-phase simulation). Alternatively, two-phase simulations are often discussed.
But in this case a set of 3D Navier Stokes had to be formulated for each phase - one for the powder and one for the binder - and both had to be coupled in an appropriate way. If different powders and different binder-components are mixed to a feedstock even more than two phases and more than two sets of equations would have to be considered. A multi-phase simulation is exceptionally time- and hardware-consuming and therefore not practicable for daily use in a production or mould design environment at the moment.
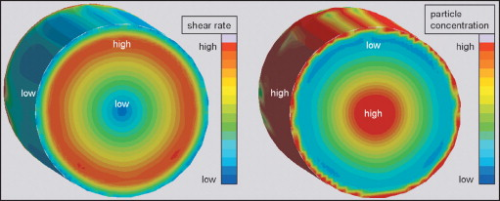
A compromise is to model the feedstock as a bulk (one-phase) but to extend the 3D Navier Stokes equations in an intelligent way so that powder and binder concentrations and their variations can be considered depending on the shear rate history. The particle concentration is modelled based on a diffusive flux model. Figure 4 shows first qualitative results. Powder particles leave the high shear rate zones and accumulate in low shear rate areas (here: flow channel centre and wall contact layer). This practical approach is currently being tested with SIGMASOFT. However, development focuses not only on the separation effects but also considers coupled effects. Separated feedstock of low particle concentration will decrease in viscosity for a certain temperature. Feedstock with elevated particle concentration will increase in viscosity. These local differences lead to a complex rheological behaviour, which can be found in plenty of applications.
Case study – watch strap
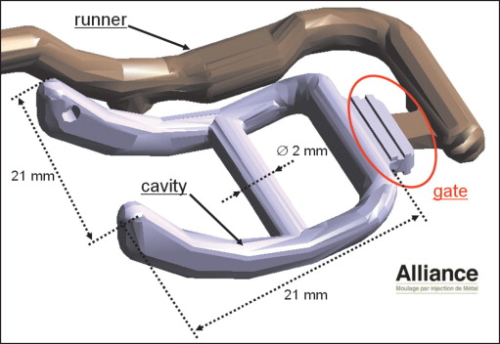
Predicting powder binder separation directly by writing local powder concentration results or true density values is a scheduled medium-term objective. Nevertheless the current available true 3D injection system simulation is already able to give productive results for predicting separation, because SIGMASOFT makes the feedstock moulding history accessible. It just calls for an appropriate methodology to set up MIM projects and to interpret the actual results.
This case study is provided by courtesy of Alliance [5]. Figure 5 displays the cavity, gate and runner geometry. For several months Alliance developed this particular runner and gate layout based on trial-and-error. The challenge was “black lines” occurring close to the gate and at the corners of the bridge, causing visual defects after sintering which were not acceptable to the customer. After several attempts small modifications of the gate area showed good success and the mould could be released for production. Now two ribs each on both sides of the gate collect separated binder material (= heavy black lines). The black lines on the product have been almost eliminated.
How did these four small ribs solve the problem of “black lines” to the extent that the mould could be released for production? It is difficult to answer this just from moulding experience and intuition. Simulation makes the answer easy, however.
A series of two simulations were performed. The initial simulation is a standard 3D injection system simulation showing the flow pattern, pressure losses, weld lines and the local shear rate gradients. The shear rates were then evaluated in detail and locations are identified where significant shear rate gradients occurred. Unsurprisingly, the maximum shear gradients were found in the small region at the right side of the gate area ([Figure 2] and [Figure 5]). In a sliced view the small layer of maximum shear close to the top and bottom gate wall becomes evident. In exactly these areas tracer particles were defined for the second simulation. Tracer particles are virtual particles used in SIGMASOFT to visualise 3D flow phenomena. Tracer particles have no mass and no volume and do not interact with the feedstock. They are just for visualisation of flow paths: this is the feedstock history.
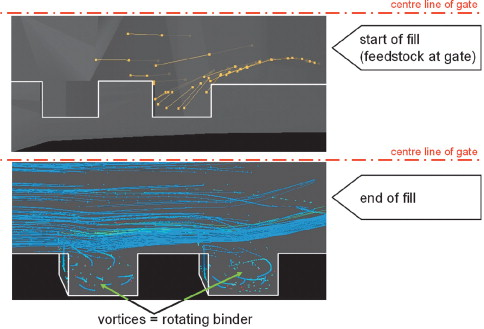
The first simulation gives the shear rate maxima and the second simulation subsequently visualises the feedstock moulding history by tracer particles and clarifies why the four small ribs are successful. The gate itself is made from two regions. A small entry area is shown on the right side of the gate. A significant shear fields is established here (Figure 2). The shear gradients generate powder – binder separation and thus two layers of high binder content close to the flow channel wall (according to our approach, Figure 1). In these areas Tracers are released in the second simulation. Subsequently the feedstock travels into the left area of the gate. Here the flow channels opens and on top and on bottom the two ribs perpendicular to the flow direction show up. These changes in the flow channel geometry generate four vortices trapping the two binder rich layers successfully in the ribs before flowing into the cavity, Figure 6. This illustration shows the tracer-particle result at two time steps during filling phase. The flow direction is from right to left. At the top the start of the filling phase is displayed. Tracer particles just enter the rib area of the gate. At the bottom a snap shot shortly before end of fill is displayed illustrating the vortices nicely. Both result pictures are sliced views into the gate, each from a slightly different perspective. The outer contour of the gate geometry is highlighted by a white line.
The injection moulding simulation with SIGMASOFT was validated, reducing mould design and process setup efforts for MIM applications. A prediction of phase separation is possible applying a small series of simulations to identify probable defect locations in the green part. To know this in advance before building the mould helps to reduce development time and costs significantly and leads to stable processes and higher product quality. Software development is already underway to finally close the gap and give local density values as direct result. When this milestone is reached the link between properties of the green part and quality of the sintered product will have been realised.
For references, contact the author.


