There are good reasons to do bath monitoring and surface cleanliness testing. Testing provides a level of confidence and demonstrates a level of due diligence. The first is to demonstrate quality to current customers (1). The second is to demonstrate quality to customers you do not yet have. The third, most important reason is to demonstrate quality to yourself.
Value-Added Testing. Cleaning processes have to be value added; you should clean critically. It is a waste of money to do a cleaning process simply because Mom told you—unless Mom is the boss. The same holds for surface cleanliness testing and process monitoring. A good first step is make a list of all the routine required, semi-required, and traditional cleaning tests. Then check the rationale. If a key customer requires the test, running the test is usually in order. On the other hand, the testing requirement may go back several decades; your company may have a totally different customer mix.
Perhaps the test is related to the process fluids or to specific manufacturing and cleaning processes. For example, some companies cling to the concept of testing for free chlorine long after they have elected to replace chlorinated chemicals with non-chlorinated or aqueous processes. The rationale is that such testing keeps them out of trouble. However, the act of testing in and of itself is not what keeps us out of trouble; it is less expensive to keep a four-leaf clover around. Also, spending money on uninformative, inapplicable tests cuts profits and diverts efforts from tests that are actually needed. The important thing is to devise testing plans appropriate to the contaminants that are likely to get you into hot water. Observe and Record. Parts manufacturers and their customers like metrics in part because numbers can, at least in theory, be reproduced; and tests can be turned into a pass/alert/fail system. However, all testing, from low-cost, in-house testing to very costly, specific analytical testing is built on observations—observations by people or by complex equipment. We often advise people to harness the observational power of their employees. Time and time again, we see situations where a vigilant employee is the first to see a problem in surface quality. Many of their observations are visual. Unfortunately, visual observations are looked down on as being “semi-scientific.” We disagree. With the complexity of manufacturing processes and the growth of disparate worldwide supply chains, the number of variables becomes so great that—while visual observation is not sufficient—it is a necessity. There are good ways to get a handle on visual observations of surface quality. Harness the process voyeurism of your employees. We have seen instances where enthusiastic production people write their observations of surface quality in sufficient detail that we were able to piece together the sources of process problems and provide solutions to improve yield.
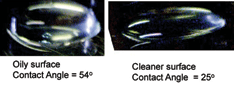
Writing observations can be time-consuming and subject to interpretation. One simple approach is to invest in an inexpensive digital camera and digital microscope, and let your employees use these to keep visual records of the product surface. Of course, this involves making a judgment call of what constitutes clean enough. In addition, in some instances, visual contamination might not actually be a problem. For example, a degreased fingerprint might not be an issue if aluminum oxide blast is routinely used before coating. On the other hand, an oily residue is likely to result in problems. Photographic records helps to not only document problems, but such records also help get everyone on the same page as to what a clean surface ought to look like versus visual contamination that does not interfere with manufacturing. Monitoring Process Fluids and Baths. For incoming process chemicals, working with reliable suppliers who can—when appropriate—provide a certification of analysis. Keeping records of this analysis is often useful. However, unexpected problems can arise. Therefore, visual observation by production people is often helpful. Monitoring of process baths can be used to avoid problems due to contamination and to avoid unnecessary both changeout. Water-Break Tests. If water beads up on a freshly-polished car, most people consider it to be clean, as well. The surface actually has wax, which would be considered to be beneficial contamination. In manufacturing, if a metal part has had the right cleaning prior to plating or coating, the surface will not have the same sort of polish as a car, and water will “sheet” off of it. Some manufacturers simply observe the appearance of water drops; others use standardized methods. For example, one ASTM method (2) is an atomizer test where water is sprayed onto a surface to see if the drops coalesce or remain as discrete drops. The discrete drops could indicate the presence of oily residue. In another ASTM method (3), a test sheet is pulled vertically from water, and the observer notes whether the water sheets off or remains as drops. Both methods are in the process of being updated because, while they are non-quantitative, they have been found useful, perhaps for centuries, in assessing surface cleanliness (4). A military specification describes a slightly different water break test that can be incorporated into a coating or painting procedure (5). Water is sprayed onto a surface with an atomizer. It passes the test if the water drops coalesce into lenses (large, flat drops). It fails if small, hemispherical drops are formed or if the water flashes and sheets suddenly, indicating possible residual cleaning agent. Contact Angle. The contact angle is a quantitative water break test. Measuring the contact angle provides a number that can be recorded as an indication of surface monitoring and indicates process trends. Traditionally, contact angle measurement uses a goniometer; the test is typically run in a laboratory.
Digital camera contact angle testing is currently under development at Sam Houston State University(6). The approach promises to move the technique from the lab to the production line. Equipment is relatively inexpensive and readily available. Some equipment is required. You need an image digitizer; this can be a digital camera, a digital microscope, or a smart-phone camera (which works better with a wide-angle lens). A pipette or syringe, or even a stirring rod, can be used as a drop dispenser . There are somewhat different requirements depending on how you measure the water drop; a top-down method requires a size calibration reference like a metal washer and an accurate measure of drop volume. A side-view method (Figure 1) requires a small right angle prism or 45° mirror to redirect the image into the camera. While calculating the contact angle requires basic trigonometry, the whole system can be set up in a spreadsheet for convenience in routine use.The technique is promising; it is still under development to maximize convenience and reproducibility and to minimize bias. How Clean is Clean Enough? No one really knows. We do know what is not clean enough, and we may know what is too clean. Cleanliness testing and process monitoring are always a judgment call. The determination of cleanliness is backed up by lessons learned from failures, surface and analytical tests that may or may not include industry standards, and past performance by similar products.
The bottom line is that if the product works reliably for the intended purpose it is clean enough. However, relying on past product performance may not provide the reliability information to give you competitive advantage. Testing provides documentation and detects trends. An alert level may let you know that, while surface cleanliness is currently acceptable, the process is about to go over a cliff.
REFERENCES
- Kanegsberg, B. and E. Kanegsberg, “How Clean is It? Rapid, Low-Costs Tests You can Do,” SUR/FIN 2012, June 12, 2012, Las Vegas, NV.
- ASTM F21-65, Standard Test Method for Hydrophobic Surface Films by the Atomizer Test
- ASTM F22-02(2007), Standard Test Method for Hydrophobic Surface Films by the Water-Break Test
- N. Lowrey comments in, “ASTM Space Simulation Committee Seeks Input on Revisions to Hydrophobic Standards,” http://www.astmnewsroom.org/default.aspx?pageid=2708, February 17, 2012.
- MIL MIL-C-53072B Chemical Agent Resistant Coating (CARC) System Application Procedures And Quality Control Inspection
- D. Williams, A. Kuhn, T.O’Bryon, M. Konarik and J. Huskey, “Contact Angle Measurements Using Cellphone Cameras to Implement the Bikerman Method,” Galvanotechnik, Vol. 109, Issue 8, pg 1718-1725 (Aug., 2011).
ABOUT THE AUTHORS Barbara Kanegsberg and Ed Kanegsberg Ph.D., “the Cleaning Lady and the Rocket Scientist” of Los Angeles-based BFK Solutions LLC (founded in 1994), are the industry leaders in critical/precision and industrial product cleaning. As independent consultants, they help manufacturers achieve rugged, trouble-free processes in areas such as metal forming and fabrication, aerospace, medical device manufacturing, electronics, optics, and consumer products. They are members of JS3, an interagency military/NASA working group involved with cleaning processes and Mil-spec development. They also write regularly for trade journals in the U.S. and overseas. Barbara and Ed are editors/contributors for the acclaimed, expanded two-volume Second Edition of the “Handbook for Critical Cleaning,” CRC Press, 2011. Contact: 310-459-3614 info@bfksolutions.com.


